
Could your social media posting be best described as a finger-crossed, willy-nilly firing of content into the online abyss? We get it, it’s a wild world out there full of the insta-afluent and social media icons. But what if we told you that their success is leveraged off a tool that you too have access to?
Welcome to the world of social media analytics – A.K.A metrics, insights, or dashboards.
Analytics aren’t as intimidating or indecipherable as they may seem – we promise. Social media platforms actually have free, in built tracking tools that are quite simple to use once you know what to look for.
You’d be absolutely bonkers not to take advantage of these tools, too. Analytics are essentially like your portal into the minds of your audience. We’ll guide you through what social media analytics are and how you can start tracking them.

An Overview
Social media analytics are actually super cool – or perhaps that’s our inner marketing geek shining through? But seriously, considering these tools are handed to you for free, they offer some exceptional insights into your audience behaviour. This makes it easier than ever to create targeted, successful social media campaigns that produce tangible results.
Each platform will have its own analytics portal. For Instagram, Facebook and Pinterest you’ll need business pages to activate analytics. Instagram’s analytics can be found under the ‘insights’ tab, while Facebook calls theirs a ‘professional dashboard’. Twitter ups the ante with its own separate portal know as Twitter Analytics. On LinkedIn, you’ll simply need to be a Page Admin to see those numbers firing.
Now that you know where to find them, here’s our humble option on the best social media analytics to keep an eye on.
Customer Demographics
Let’s strip it right back to the basics. Your social media content should be curated towards your specific audience segment, right? But how do you gather the specifics on your ambiguous collection of followers?
You guessed it!
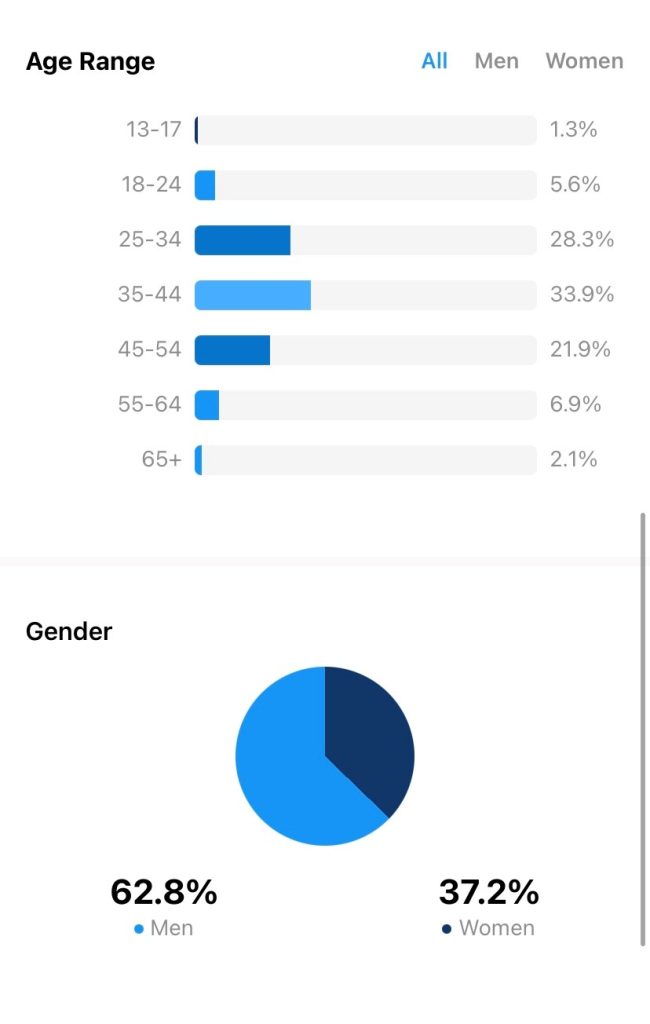
Demographic insights provide a super simple breakdown of your followers by age, location and gender.
It might seem rudimentary, but these details can help pave the way for your content planning. It goes without saying that an audience of 18-25 year old males will seek out vastly different content to that of the 40-50 year old woman. Use your demographic info to inform not only the content you are posting, but which platforms are going to deliver the best visibility to your desired market.
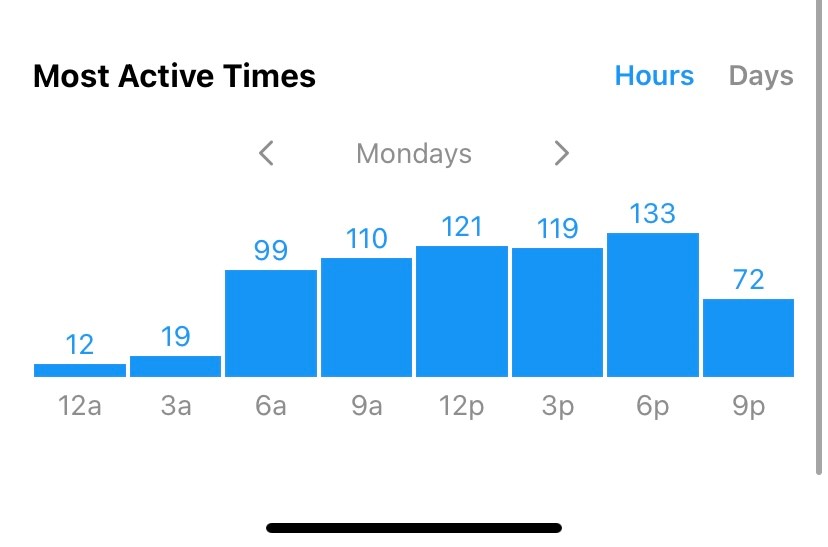
Audience Active Times
This handy feature provides key insights into when your followers are most active online. Usually structured into a bar graph, you’ll be able to view the peak times of follower activity. This is incredibly useful for scheduling posts, as you can target it to when it’s most likely to be viewed by your followers. You can either manually post during these ‘prime times’ or use scheduling apps like Hootsuite to set up an optimised, automated posting schedule.
Engagement Rates
We’re not really a fan of focusing on ‘engagement rates’ as a whole. It’s such a sweeping, broad term that it can be hard to deduce much meaning from its figures. ‘Engagement’ encompasses everything from likes and comments through to reshares, retweets and link click throughs. Each post will have a brief overview of its performance metrics visible.
In this case, the most important metric to track will depend on what your objectives are. If your goal is to increase brand awareness and visibility, then you’ll need to track your reach rate. However, if you’re looking to promote clickthrough to your website, you’ll want to keep an eye on those link clicks.
We highly recommend setting S.M.A.R.T goals to measure your metrics against.
Video viewing times
Posting video content is a huge tick in the social media play book. It’s proven that video is the superior content medium across almost every platform. But how long should your videos be? Similarly, to the posting schedule, you can actually use your metrics to answer this.
Facebook in particular has a handy tool called ‘audience retention’ which maps out how long your viewers are sticking around for.
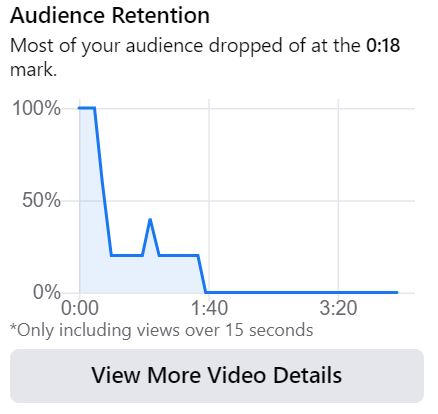
This doesn’t need to be a hard a fast rule, but it’s certainly worth keeping in mind when making the final editing cut.
Now, it’s one thing to pull up a bunch of numbers and graphs, it’s another to be able to derive meaning from them. Analytics aren’t going to hold much value unless you have some goals or objectives to measure them against. Tracking your analytics should slot in as part of a structured social media strategy.
If you don’t have a social media plan in place, you may as pack it in now. We’re kidding, of course – that’s what we’re here for!
You focus on running a killer business, while our Wordly social media superstars curate a personalised social media campaign aligned to your company goals. We’ll even crunch the numbers and track those glorious analytics for you! Shoot us a message to get the ball rolling on your prospective social media expedition.